
Formula One pitstop strategy via explainable reinforcement learning
In brief
- Formula One race outcomes depend heavily on selecting optimal tyre compounds and timing pitstops in a dynamic multi-agent environment.
- Industry standards rely on static linear optimization and Monte Carlo simulations that struggle with unpredictable opponent interactions.
- Race Strategy Reinforcement Learning (RSRL) learns adaptive pitstop policies, outperforming best baselines on Grand Prix circuits while providing transparent explanations.
This retrospective explainer is dated to the March 2025 ACM SAC conference. It discusses Explainable reinforcement learning for Formula One race strategy by Devin Thomas, Junqi Jiang, Avinash Kori, Aaron Russo, Steffen Winkler, Stuart Sale, Joseph McMillan, Francesco Belardinelli and Antonio Rago.
During a Formula One Grand Prix, once the five red lights go out, engineers are barred from modifying the mechanical configuration of the car. The engine map, suspension stiffness, and aerodynamic wings are locked in place. The single most impactful lever remaining to the pit wall is race strategy: deciding when to pit, how many pitstops to make, and which tyre compound (Soft, Medium, or Hard) to fit to the car.
A pitstop costs roughly 20 to 25 seconds of race time. Pitting too early leaves a driver stuck in midfield traffic on fresh tyres; pitting too late causes tyres to “fall off the cliff,” losing seconds per lap due to thermal degradation.
While top teams run millions of Monte Carlo simulations before and during the race, these simulations assume predictable opponent behaviors. This paper introduces Race Strategy Reinforcement Learning (RSRL), training RL agents to make dynamic pitstop decisions in simulated Grand Prix races while equipping pit wall strategists with explainable decision rules.
Modelling the non-linear physics of tyre degradation
Tyre performance is the heartbeat of F1 race strategy. Soft tyres offer maximum grip and fastest initial pace, but degrade rapidly. Hard tyres are durable and resist degradation over long stints, but are substantially slower over a single flying lap.
The paper models lap time penalty $\Delta t_{\text{lap}}(\tau, c)$ as a function of tyre age $\tau$ (laps completed on the current set) and compound $c \in {\text{Soft}, \text{Medium}, \text{Hard}}$:
\[t_{\text{lap}}(\tau, c) = t_{\text{base}} + \Delta t_{\text{fuel}}(l) + \Delta t_{\text{compound}}(c) + \alpha_c \, \tau + \beta_c \, \tau^{\gamma_c},\]where $t_{\text{base}}$ is baseline car pace, $\Delta t_{\text{fuel}}(l)$ accounts for the car becoming lighter as fuel burns, and $\alpha_c, \beta_c, \gamma_c$ characterize compound-specific degradation kinetics.
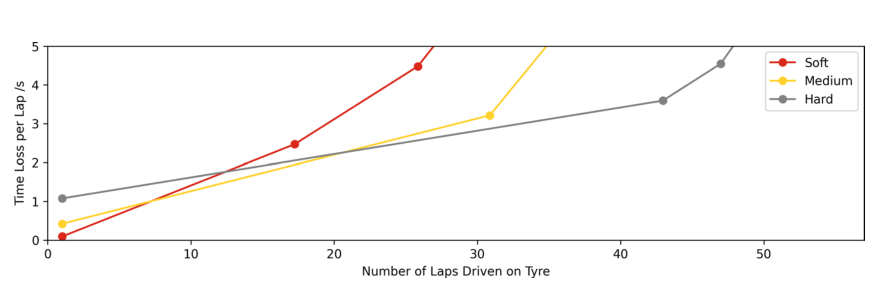
As shown in the degradation curves, a Soft tyre degrades sharply after 20 laps, losing upwards of 4.5 seconds per lap. A Hard tyre can endure over 40 laps with modest, predictable wear.
The reinforcement learning formulation
The race is modeled as a Markov Decision Process (MDP) $\langle \mathcal{S}, \mathcal{A}, \mathcal{P}, \mathcal{R}, \gamma \rangle$:
- State Space $\mathcal{S}$: Current lap $l$, driver’s track position, gap to cars ahead and behind, tyre compound $c$, tyre age $\tau$, estimated weather/track temperature, and safety car status.
- Action Space $\mathcal{A}$: At the end of each sector, the agent selects: \(a \in \{\text{Stay Out}\} \cup \{\text{Pit for Soft}, \text{Pit for Medium}, \text{Pit for Hard}\}.\)
- Reward Function $\mathcal{R}$: Because F1 points are awarded strictly based on final finishing position (25 points for P1 down to 1 point for P10), intermediate rewards reward delta lap times while the terminal reward reflects final race standing: \(R_{\text{total}} = - \sum_{l=1}^{L} t_{\text{lap}}(l) + \lambda \, \mathrm{Score}(\text{Position}_{\text{final}}).\)
The policy $\pi_\theta(a \mid s)$ is trained using Proximal Policy Optimization (PPO), learning to anticipate undercut tactics (pitting one lap early to jump ahead on fresh tyres) and overcut tactics (staying out in clean air while an opponent is mired in traffic).
Empirical results and explainability for race engineers
On a simulation of the 2023 Bahrain Grand Prix with 20 competing cars:
- Cars configured with a baseline vehicle pace corresponding to an expected finishing position of P5.5 were handed to RSRL.
- RSRL achieved an average finishing position of P5.33, outperforming the best Monte Carlo baseline (P5.63).
- RSRL consistently recognized when rivals suffered severe tyre cliffing, triggering reactive pit windows that standard static plans missed.
To bridge the trust barrier with human race strategists, the authors deployed post-hoc feature attribution and decision tree distillation. The extracted rules revealed that RSRL’s decisions were driven primarily by traffic gap windows rather than raw tyre age: the model preferred staying on worn tyres for two extra laps if pitting immediately would drop the car behind a slower backmarker.
Paper and sources
- Devin Thomas, Junqi Jiang, Avinash Kori, Aaron Russo, Steffen Winkler, Stuart Sale, Joseph McMillan, Francesco Belardinelli and Antonio Rago. Explainable reinforcement learning for Formula One race strategy. ACM SAC 2025, pages 1090–1097.