
Explaining an image classifier through a hierarchy of symbols
In brief
- The method explains a trained image classifier using a learned hierarchy of discrete symbols.
- Hyperbolic space helps represent branching relationships between fine and abstract features.
- The resulting knowledge tree describes the classifier; it does not automatically provide human-labelled concepts.
This retrospective explainer is dated to the June 2023 CVPR workshop publication. It discusses Robust Hierarchical Symbolic Explanations in Hyperbolic Space for Image Classification by Ainkaran Santhirasekaram, Avinash Kori, Mathias Winkler, Andrea Rockall, Francesca Toni and Ben Glocker.
A heatmap can show which part of an image influenced a classifier. It is less clear how that region relates to a more abstract explanation. If a model predicts “cat,” a reader may want to move from image details to parts and then to the whole animal.
This paper studies explanations at several levels of abstraction. It turns a trained classifier’s continuous features into discrete symbols, learns relationships between those symbols and uses the resulting knowledge tree to describe a prediction.
The point is not to give the classifier a vocabulary written by a human. The symbols are learned from the model’s representations. Their meaning must be examined through the images and features associated with them.
From continuous features to symbols
An image classifier usually converts pixels into a vector of features before making a prediction. Individual coordinates in that vector need not correspond to familiar concepts. A coordinate might combine texture, colour and shape in a way that is useful for classification but difficult to name.
The paper uses quantisation to replace continuous feature vectors with entries from a learned codebook. A codebook is a finite collection of representative vectors. Think of sorting many colour samples into a smaller collection of swatches: each sample is represented by a nearby entry, while some fine variation is discarded.
Here the entries represent learned visual features rather than colours. This gives the method discrete units that can participate in a hierarchy. The model is trained to retain information needed to reproduce the original classifier’s behaviour.
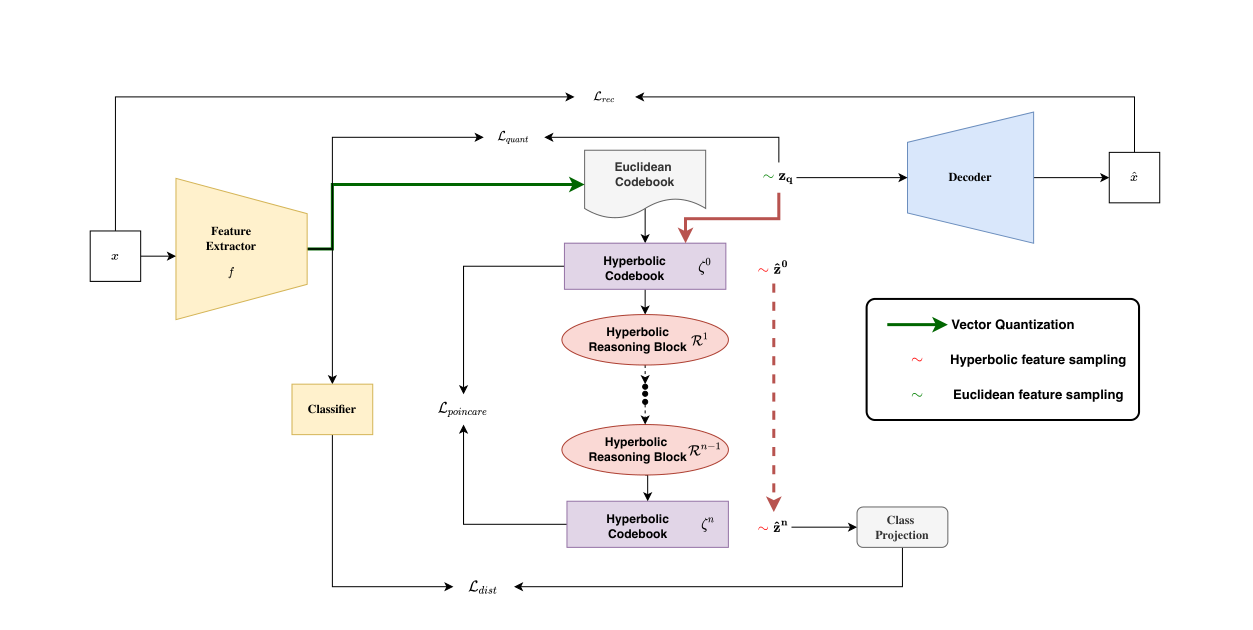
The diagram separates the original feature extractor and classifier from the explanation machinery. That separation is important: the explanation is a learned account of an existing model, so its agreement with that model must be evaluated.
Why use a hierarchy?
An explanation can be useful at more than one resolution. At a detailed level, it may point to small visual features. At a higher level, it may connect several features to a more abstract symbol associated with a class.
The paper learns relationships between consecutive codebooks using binary connections. A connection indicates that a symbol at one level contributes to a symbol at the next. These relationships form the knowledge tree.
A family tree is a useful analogy for the geometry, although the learned relationships are not biological ancestry. As a tree branches, the number of descendants grows quickly. A representation needs room to keep branches distinguishable while preserving their relationships to shared ancestors.
The paper uses hyperbolic geometry because its spatial structure is well suited to representing branching hierarchies. In an ordinary flat diagram, many branches eventually crowd together. A hyperbolic representation can allocate more space as one moves outward, reducing distortion in the embedding of a tree.
What “hyperbolic” means here
The model uses mathematical representations of a space with negative curvature. The Poincaré ball is one such representation. Its domain, defined in the paper, is:
\[\mathbb{B}^{d,1}=\{x\in\mathbb{R}^{d}:\lVert x\rVert<1\}.\]This says that the displayed coordinates lie inside a unit ball in d dimensions. The norm measures distance from the centre in the displayed coordinates. The geometry used to compare points is not ordinary straight-line geometry inside that drawing.
The boundary is therefore not just the edge of an ordinary picture. Distances behave differently near it. That distinction helps explain how a bounded diagram can represent an expanding hierarchy.
The paper uses mappings between hyperbolic representations and tangent spaces to perform learned transformations and aggregation. A reader does not need to reproduce those operations to understand the explanatory pipeline: features become symbols, symbols are combined at successive levels, and paths through the resulting structure provide explanations.
Reading a chain of symbols
For a particular image, the method identifies relevant symbols and follows their connections toward the class representation. The resulting chain is a local explanation: it concerns that image and the classifier’s response to it.
The same learned structure can also provide a global account of how features relate to a class across images. Local and global explanations answer different questions. One describes a particular prediction; the other describes recurring structure in the model.
Visualising what activates a symbol is essential. A node should not be labelled “eye” merely because that name makes a convenient story. It may respond to several features, including some that humans would not group together. The paper connects symbols with visual semantics so their interpretation can be inspected.
The analogy with parts and wholes is useful, but it should not be taken as a guarantee that every learned edge is an anatomical or physical part-of relationship. It is a relationship learned while explaining a classifier.
What the experiments test
The paper examines whether the discrete hierarchy can preserve classification behaviour and produce explanations that are stable under input perturbations. It also compares geometric choices, testing the role of hyperbolic representations rather than assuming that a tree-shaped visualisation is sufficient evidence.
These questions should remain separate. Agreement with the original classifier concerns fidelity. Stable explanations under small changes concern robustness. A visually appealing hierarchy concerns neither automatically.
For example, an explanation could stay unchanged when an image is slightly corrupted, yet consistently describe the wrong feature. Conversely, an explanation could faithfully expose a classifier’s sensitivity to an irrelevant texture. That would be useful evidence about a model weakness even if it is not reassuring.
What the method contributes
The contribution is a route from opaque continuous features to inspectable explanations at several levels. Quantisation provides discrete symbols, learned connections provide hierarchy, and hyperbolic geometry supplies a representation suited to branching structure.
The result is still a model of a model. Distilling a classifier into a knowledge tree introduces approximation, and the quality of that approximation must be checked. Learned symbols also require interpretation; they are not automatically a verified vocabulary of human concepts.
For a reader inspecting an explanation, the practical questions are concrete: which symbols were active, what image evidence do they correspond to, how do they connect to the predicted class, and how faithfully does this chain describe the original classifier? The hierarchy makes those questions easier to ask than a single undifferentiated feature vector.
Paper and sources
- Ainkaran Santhirasekaram, Avinash Kori, Mathias Winkler, Andrea Rockall, Francesca Toni and Ben Glocker. Robust Hierarchical Symbolic Explanations in Hyperbolic Space for Image Classification. CVPR Workshops 2023, pages 561–570.