
LiTS: why a good liver outline can still miss a tumour
In brief
- LiTS evaluates liver and tumour segmentation on a shared collection of abdominal CT scans.
- Overlap, boundary accuracy and lesion detection measure different kinds of success.
- A model can achieve a strong segmentation score while missing small lesions.
This retrospective explainer is dated to the February 2023 journal issue; the benchmark events took place in 2017–2018. It discusses The Liver Tumor Segmentation Benchmark (LiTS) by Patrick Bilic and colleagues, including Avinash Kori.
Imagine drawing an outline around a country on a map. Most of the outline could be correct even if several small islands were missing. The same distinction appears in medical image segmentation: correctly outlining a large organ does not mean finding every small lesion inside it.
The Liver Tumor Segmentation Benchmark, or LiTS, makes that distinction measurable. It brings together abdominal computed tomography (CT) scans, reference annotations and a common evaluation procedure. Rather than introducing one segmentation network, the paper examines how many submitted methods perform under the same benchmark conditions.
The journal article appeared in 2023 and reports challenges held in 2017 and 2018. Its results are a record of those evaluations, not a claim about the best models available today.
What the benchmark asks a model to do
A CT scan is a three-dimensional volume made of small elements called voxels. Segmentation assigns a label to each voxel: for example, background, liver or tumour. A predicted segmentation can be compared with the reference annotation to measure how closely the two agree.
LiTS separates related tasks. Liver segmentation identifies the organ. Tumour segmentation identifies lesions within it. Tumour burden concerns how much of the liver volume is occupied by tumour. These tasks share an image but have different failure modes.
The dataset includes 131 training volumes and 70 held-out test volumes from different patients, collected through seven clinical sites. The paper compares 75 submitted algorithms. A shared test set matters because a result on an easier collection of scans cannot be compared directly with a result on a harder one.
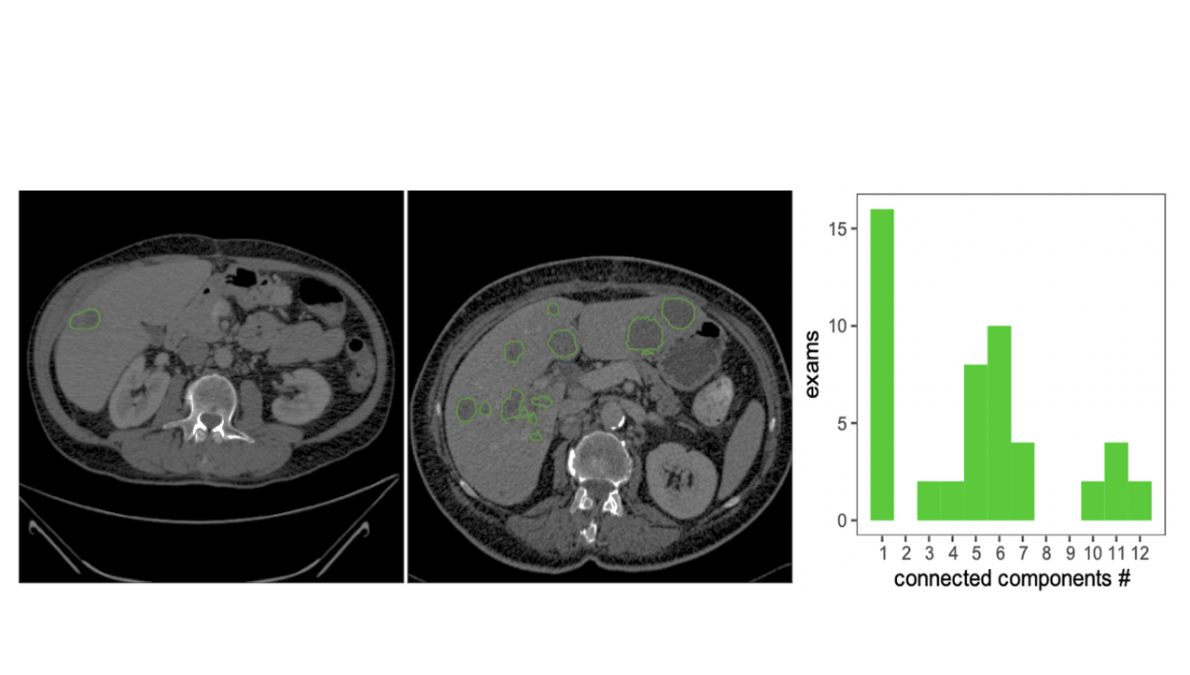
The images vary in lesion size, shape and contrast. Some lesions stand out clearly from the surrounding tissue; others have less distinct boundaries. The figure is useful because it shows why this is not simply a matter of finding one consistently coloured region.
What the Dice score actually measures
One central metric is the Dice similarity coefficient. Using the paper’s set-based formulation, let A be the reference region and B the predicted region:
\[\mathrm{Dice}(A,B)=\frac{2|A\cap B|}{|A|+|B|}.\]The vertical bars count voxels, and the intersection contains voxels labelled as belonging to the region in both masks. A score of one means perfect agreement. A score of zero means there is no overlap.
For a simple example, suppose the reference contains 100 voxels, the prediction contains 100 and 90 overlap. The Dice score is 0.9. That tells us how much the regions agree, but it does not say where the ten missing voxels are. They could form a narrow boundary error or an entire small lesion.
This is why Dice is informative but incomplete. Large structures contribute many voxels, so good performance on them can dominate an overlap calculation. A small missed lesion can matter substantially while making only a small difference to a volume-based score.
The paper also evaluates surface distances and volume differences. Surface distances describe boundary disagreement. Relative volume difference measures whether the predicted region is too large or too small. Two masks can have identical volume while occupying different locations, so volume agreement also needs an overlap or boundary measure.
Finding lesions is a separate test
To evaluate detection, the authors identify individual lesions as three-dimensional connected components. Predicted and reference components must then be matched before counting detected, missed and false-positive lesions.
This is more involved than counting disconnected blobs. A prediction can merge two lesions into one component, or split a single lesion into several. The matching procedure therefore matters to the resulting precision and recall.
Recall asks what fraction of reference lesions were detected. Precision asks what fraction of predicted lesions corresponded to reference lesions. A model that labels many suspicious regions may find more lesions while producing more false positives. A model that produces only a few confident predictions may do the reverse.
The benchmark found that the strongest segmentation methods were not necessarily the strongest detection methods. That is the practical lesson of the map analogy: drawing the mainland accurately and finding every island are related, but different, achievements.
What the reported results show
Across the reported events, the best liver segmentation reached a Dice score of 0.963. The best tumour segmentation scores were 0.674, 0.702 and 0.739 for the three challenge evaluations. These figures show that identifying the liver and delineating its tumours presented substantially different difficulties.
The retrospective detection analysis reported best lesion-wise recalls of 0.458, 0.515 and 0.554 across those events. These are detection results under the paper’s matching procedure. They should not be confused with Dice scores or interpreted as patient-level diagnostic sensitivity.
No single algorithm was best at both liver and tumour segmentation across all three events. The paper therefore provides stronger support for evaluating several aspects of performance than for declaring one architecture universally preferable.
How to interpret a benchmark ranking
A ranking condenses many individual cases into a small number of scores. Before using it to select a method, it helps to ask whether the errors that matter to the intended application are visible in those scores.
For outlining the liver, boundary placement and total volume may be central. For reviewing lesions, missing a small lesion or generating many false positives may be more relevant. For tumour burden, accurate relative volumes matter, but their interpretation still depends on correct localisation.
Reference annotations also have limits. Lesion boundaries can be ambiguous, and the paper discusses annotation variability and missing acquisition or demographic information. A model’s disagreement with a label is not automatically evidence that the model is wrong in an unambiguous clinical sense; nor is that uncertainty a reason to ignore errors.
LiTS provides a reproducible comparison of segmentation systems. It does not, by itself, establish performance in every hospital or the clinical safety of a deployed workflow. Its enduring contribution is the separation of questions that a single headline score can conceal: was the organ outlined, were the lesions found, and were their boundaries and volumes estimated accurately?
Paper and sources
- Patrick Bilic and colleagues, including Avinash Kori. The Liver Tumor Segmentation Benchmark (LiTS). Medical Image Analysis 84, 102680 (2023).